Ian, a 4th grader, adds sine waves at right angles to make a
bowtie
Ian has worked on graphing sine waves for about two months. See
Don's beginning Trig
to see how this can be done. He made a sine wave, then made one twice the
amplitude (twice as tall), one twice the frequency (2 waves in 360o)
and moved the sine wave to the right and left (phase changes). After doing these
on graph paper by hand, he used Derive to make these changes on the
computer.
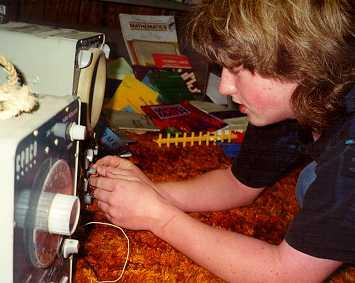
At one point Don showed Ian the output of an oscillator on
an oscilloscope screen. (see Jonathan at the
oscillator and oscilloscope). Ian played with changing the frequency of the
oscillator, then both the frequencies of the oscillator as well as on the
oscilloscope.  Ian saw a bowtie (among other
things) on the oscilloscope screen, made by the two waves at
right angles, where one wave is twice the frequency of the other. Don showed Ian how to add y = sin (2q)
and
x = sinq
on graph paper. Don didn't do a good job at first, because Ian got confused and
he plotted points that were not supposed to be there. Then Don worked with Ian
again and he got it all worked out. It took at lot of patience and persistence on his part.
His results are shown below. Fine
job, Ian!
Ian saw a bowtie (among other
things) on the oscilloscope screen, made by the two waves at
right angles, where one wave is twice the frequency of the other. Don showed Ian how to add y = sin (2q)
and
x = sinq
on graph paper. Don didn't do a good job at first, because Ian got confused and
he plotted points that were not supposed to be there. Then Don worked with Ian
again and he got it all worked out. It took at lot of patience and persistence on his part.
His results are shown below. Fine
job, Ian!
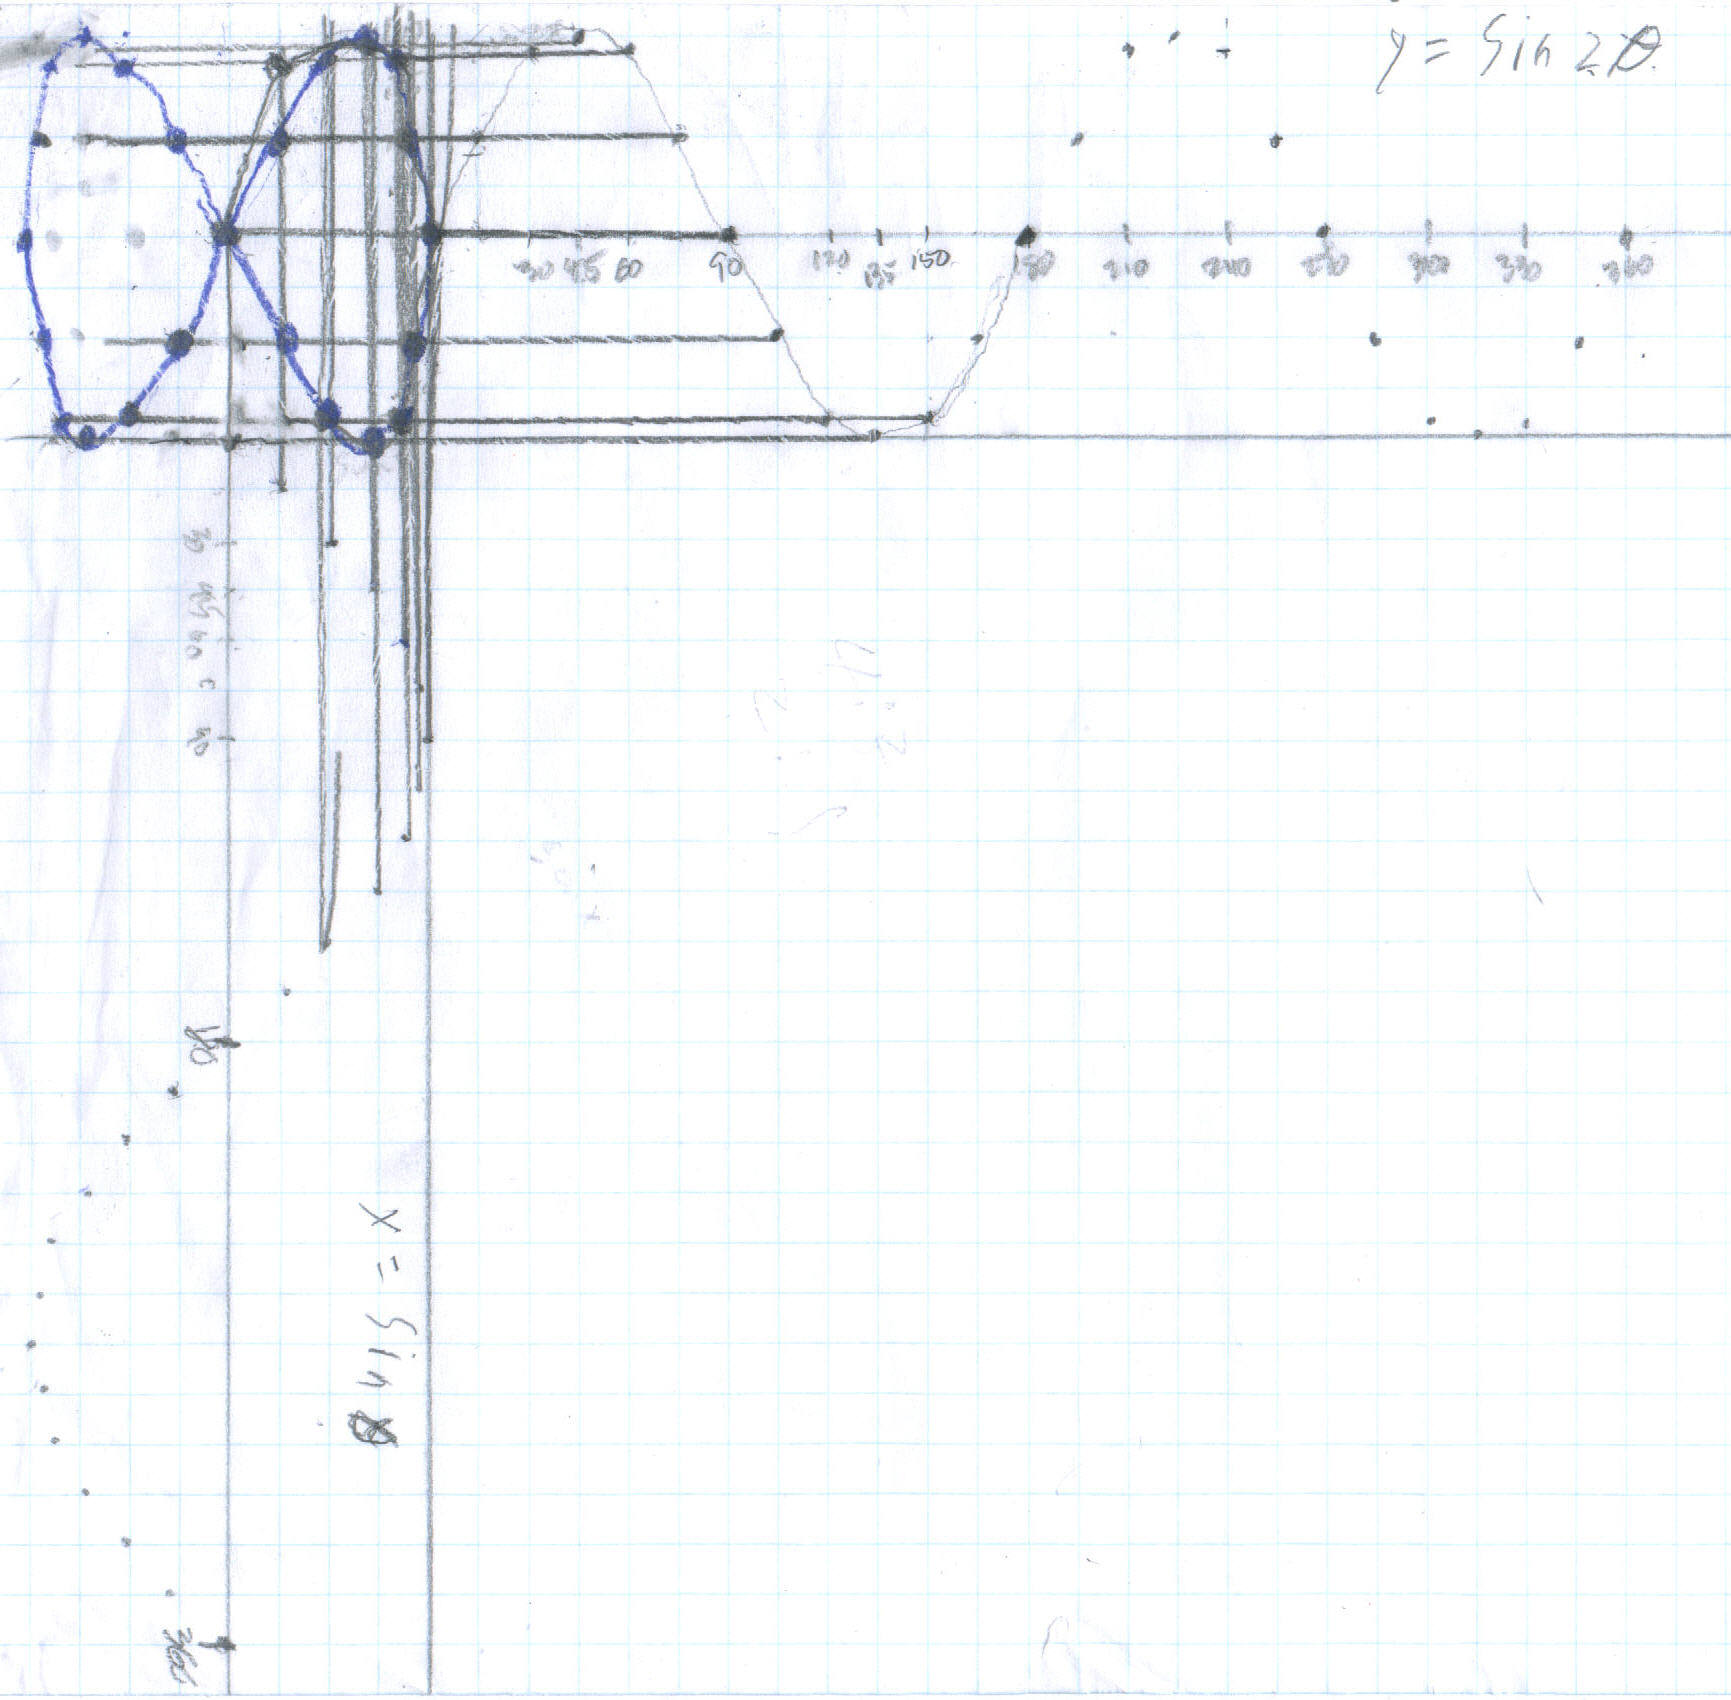
Don took Ian's graph and used it to show how the bowtie came
about from the 2 sine waves, below. There was a blank space in the upper left hand
corner square of the graph paper (an 8x8 square). The equation y = sin (2q)
was graphed starting at the right side of this square, going
to the right. On both graphs the scale was from -1 to 1 with .25 for each
little square. The equation of x = sinq
was graphed starting at the bottom of the square, going down The scale
for q
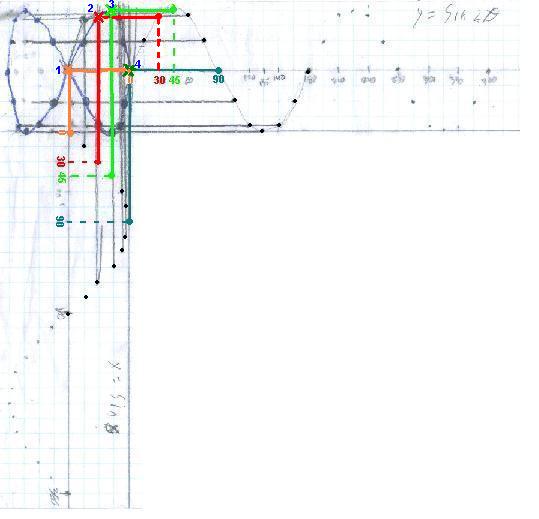
was each square was 15'. Don picked only 4 points (x's) on the bowtie at 1,
2, 3 and
4 from 0',
30' , 45',
and 90' on the two graphs. He started on
the y = sin (2q)
graph at 0', and drew a line to the left.
Then he started on the x = sinq
at 0' and went up until it
met the
other orange line; these 2 lines met at point 1,
the x.
To get point #2, he started on the y = sin (2q)
graph at 30' (went up
the dotted line to the graph), then draw a line to the
left. Then he started on the x = sinq
graph
at 30' ( the dotted line
to the right to the graph) and draw a line up to where it
meets the other red line; these 2 lines meet at point
2,
the x.
Don shows how to get the x's at points 3 and
4 by
continuing along each curve to 45',
and 90', again going to the left and
up each time. This is how Ian did the rest, every 15', to obtain the
bowtie.
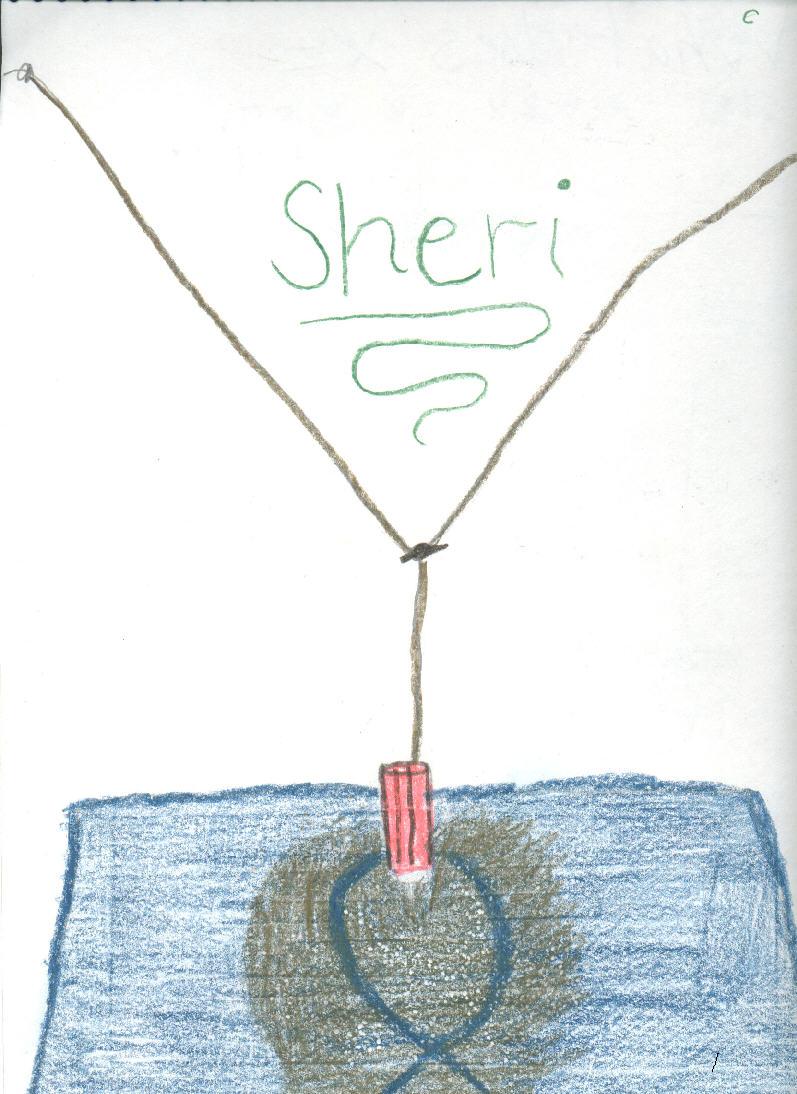
Then Don got out the compound sand pendulum with sand in a
catsup bottle, drawn here by Sheri. It is really two pendulums made with a
double length of string, one from the floor to the top of the Y where it is
attached by tacks to perpendicular walls (and the two lengths are adjustable by
means of 2 knots -not shown here). The other pendulum is from the floor to the
middle of the Y, also adjustable, by an alligator clip.
The compound pendulum acts like the oscillator and oscilloscope
where one can change the frequencies, by changing the lengths of the pendulums.
With the compound sand pendulum Ian created a pretzel, like that below:
Don showed Ian that if one went across the figure it would
intersect the pretzel 4 places (ideally), and if one went down, it would
intersect the pretzel in 3 places. So the ratio of the frequencies of the two
pendulums is 4:3. (There is a relationship between the lengths of the pendulums
and the frequencies of the waves produced, which they did not explore at this
time).
To Ian's work on an infinite series for 6/7
To beginning
trig
To
trig part 2
To
other discoveries
To download
Don's materials
Mathman home