market, especially the recent crash (written
the vertical axis could be the # of sales & the horizontal could be months.
Answers to problems in the derivative
Stories from graphs
Story #1 -> graph f; #2-> g; #3-> k; #4-> e; #5-> c; #6-> a
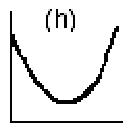
Jonathan thought that (h) would be good to illustrate the stock
market, especially the recent crash (written
the vertical axis could be the # of sales & the horizontal
could be months.