Answers for Chapter 13 Sample Problems


1. Area on the geoboard. Each triangle has an area of 1.
2. Achimedes' method of finding the area within a parabolic segment. -not shown here.
3. My progam to plot the points to make a square:
  • On the calculator
  • 1)Range -2.35, 2.35, 1, -1.55, 1.55, 1
  • 2) 0 -> x (sets left side)
  • 3) 0 -> N (counts points in both cases)
  • 4) Lbl 3
  • 5) 1 -> y (sets top of figure)
  • 6) Lbl 4


  • 7) Plot x,y (plots the point)
  • 8) 1+N -> N
  • 9) y-.07 -> y (moves next pt. down)
  • 10) y >or= 0 then goto 4 (sets bottom)
  • 11) x+.07-> x (moves next pt. to rt)
  • 12) x <or= 1 then goto 3 (sets rt end)
  • 13) "N = ": N Disp (displays no. of points)
  •     in Basic
  • 10 FOR X=0 TO 9 STEP .1
  • 15 N=0
  • 20 FOR Y=0 TO 81
  • 30 T=150 + 9*X
  • 40 V=150-Y (30 and 40 adjust for
    the way pts are plotted on the
    computer screen)

  • 50 PSET (T,V)
  • 60 N = N+1
  • 90 NEXT Y (moves next point up screen)
  • 100 NEXT X (moves next point to right)

  • 110 PRINT N
  • 120 STOP

Running this program fills in a 1x1 square; the number of dots varies with the calculator or computer. On my calculator I got 400 points. To change the program to plot the points under a parabola y = x2 from 0 to 1, replace the 1 in line 5 with x2. In the basic program change statement 20 from 81 to x2. I got the picture on the right and N=133. So the area under the curve y = x2 from 0 to 1 was 133/400, very close to 1/3 = 133/399, which is the integral of x2, from 0 to 1!!
Needless to say, this was very exciting. I showed it to everyone- teachers, students, and parents.
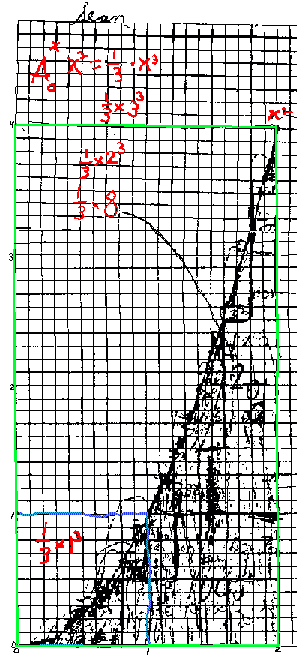
4. Finding the area under curves on graph paper: (From the scan of Sean's graph below I added the colors and some lines to make things more readable)
Matt, a 7 year old, counted the squares under y = x2 from x = 0 to x = 1. He counted 32 squares, and 32/100 of the 1 x 1 blue square below as the area. Byron, a 10 year old recently doing this, counted 42 squares and I told him to go back and do it again and be more careful. He too came up with 32. I asked Matt what simple fraction was close to this. He said 1/3; I wrote this as 1/3*1*12 or 1/3*13.

From 0 to 2 he correctly predicted 1/3 of the 2x22 rectangle or 1/3*23 (the green rectangle above) as the area under the curve y = x2 from x = 0 to x = 2.
Sean counted approximately 279 squares in going from 0 to 2, but was satisfied this was close enough. He figured there are 20*40 = 800 little squares in the 2x4 green rectangle and the area should be 1/3 of 800 or 266.66... which is close to 279. The notation I used on his graph I now have changed to and use A0-1 (x2) = 1/3*13. Then the area from 0-2 he wrote as A0-2 (x2) = 1/3*23. Writing the area this way instead of 1 and 8, makes it possible to see a pattern. I always want my students to look for patterns. Writing the answers different ways often helps to see the pattern.

What would you predict would be the area from 0-3? 0-4? 0-n?
How about finding the area under the curve y = x3 from 0-1? 0-2? 0-n?... Look for patterns!
7. The logs
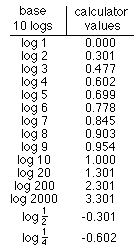
Notice 0.602 = 2*0.301 or log 4 = 2*log 2 = log 22
and 0.903 = 3*0.301
or log 8 = 3*log 2 = log 23
Generalizing,
a*log b = log ba

Some youngsters do the above first, some do the following first.
Notice also 0.301 + 0.477 = 0.778, which is
log 2 + log 3 = log 6 = log (2*3)
Test out more of these, then generalize.

How about this, log (1/ 2) = - log 2.
And log (1/4) = ? Can you generlize these statements?

PATTERNS ARE EVERYWHERE!!

Back to Ch. 13 problems
To choose sample problems from other chapters
To order Don's materials
Mathman home